library(ggplot2)

line <- ggplot(data.frame(c(1:10),c(1:10)))+
  annotate("rect", xmin = 0, xmax = 10, ymin = 0, ymax = 10, fill = "gray92")+
  annotate("rect", xmin = 0, xmax = 10, ymin = 9.7, ymax = 10, color = "black", fill = "#339966")+
  annotate("segment", linewidth = 2, x = 1, xend = 1, y = 9.5, yend = 2, arrow = arrow())+
  annotate("segment", linewidth = 2, x = 3, xend = 3, y = 9.5, yend = 2, arrow = arrow())+
  annotate("segment", linewidth = 2, x = 5, xend = 5, y = 9.5, yend = 2, arrow = arrow())+
  annotate("segment", linewidth = 2, x = 7, xend = 7, y = 9.5, yend = 2, arrow = arrow())+
  annotate("segment", linewidth = 2, x = 9, xend = 9, y = 9.5, yend = 2, arrow = arrow())+
  ylim(0,10)+
  xlim(0,10)+
  coord_fixed()+
  theme_void()+
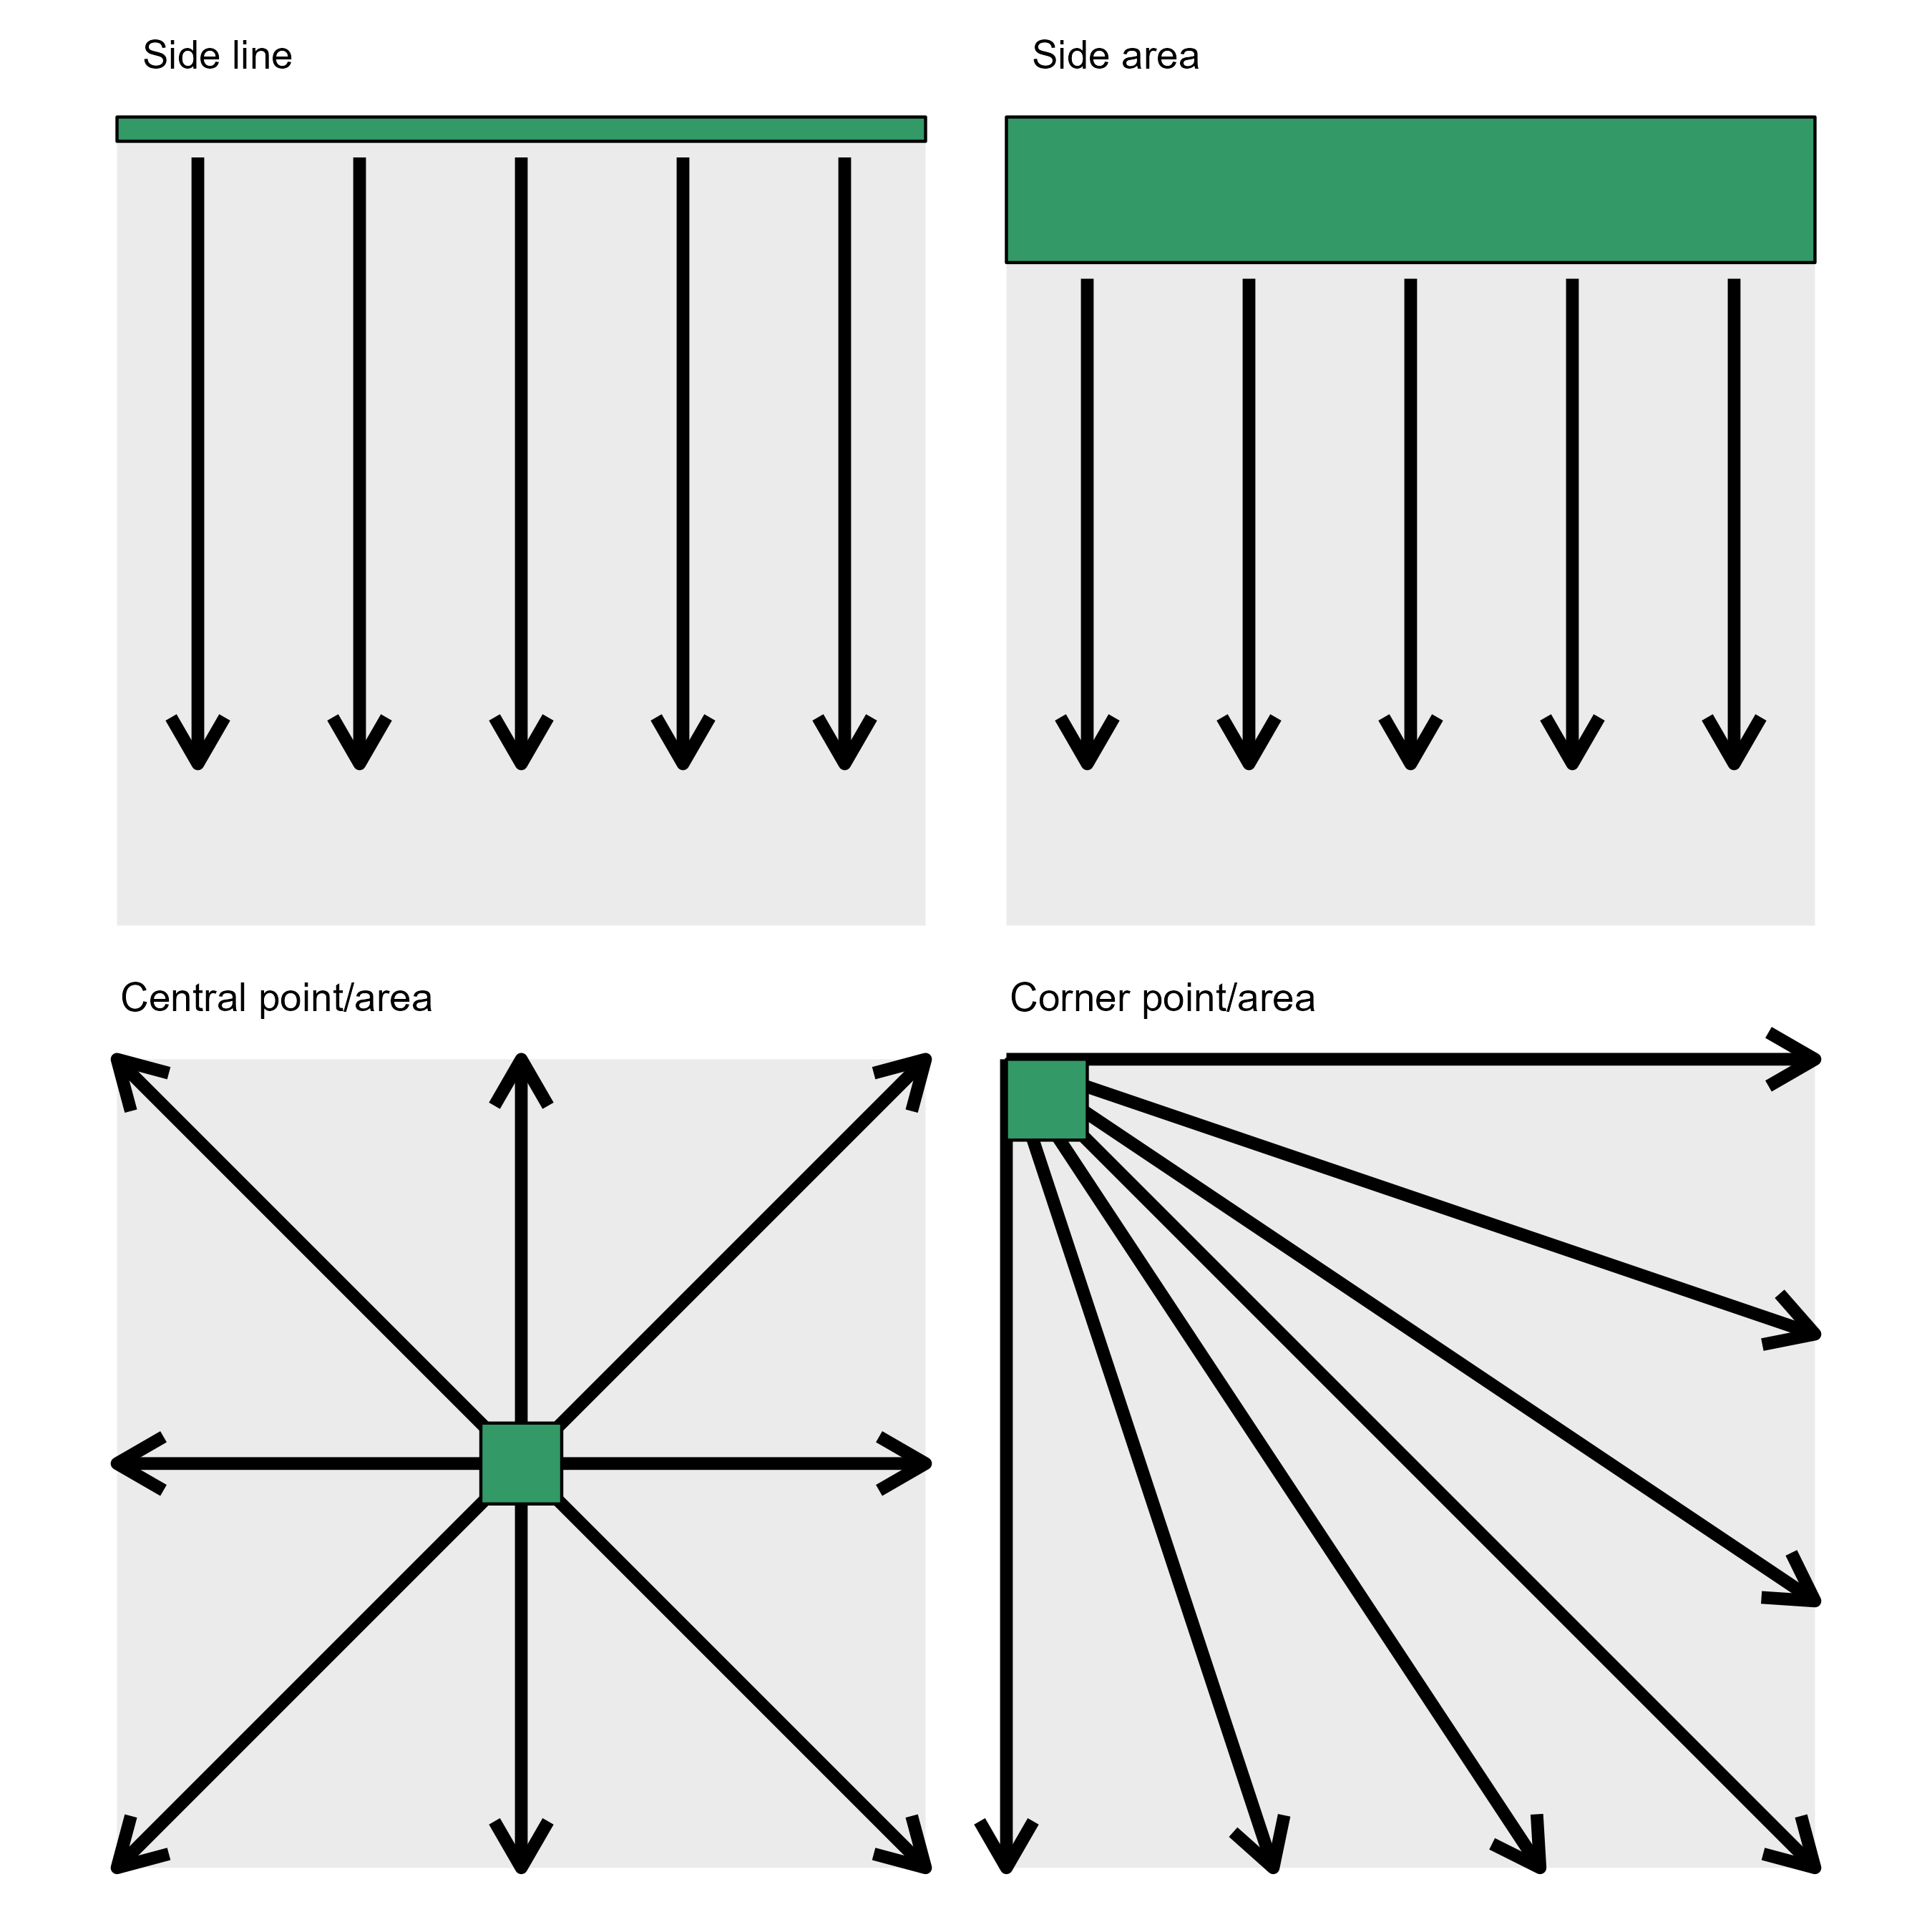
  labs(title = "      Side line")

area <- ggplot(data.frame(c(1:10),c(1:10)))+
  annotate("rect", xmin = 0, xmax = 10, ymin = 0, ymax = 10, fill = "gray92")+
  annotate("rect", xmin = 0, xmax = 10, ymin = 8.2, ymax = 10, color = "black", fill = "#339966")+
  annotate("segment", linewidth = 2, x = 1, xend = 1, y = 8, yend = 2, arrow = arrow())+
  annotate("segment", linewidth = 2, x = 3, xend = 3, y = 8, yend = 2, arrow = arrow())+
  annotate("segment", linewidth = 2, x = 5, xend = 5, y = 8, yend = 2, arrow = arrow())+
  annotate("segment", linewidth = 2, x = 7, xend = 7, y = 8, yend = 2, arrow = arrow())+
  annotate("segment", linewidth = 2, x = 9, xend = 9, y = 8, yend = 2, arrow = arrow())+
  ylim(0,10)+
  xlim(0,10)+
  coord_fixed()+
  theme_void()+
  labs(title = "      Side area")

point_central <- ggplot(data.frame(c(1:10),c(1:10)))+
  annotate("rect", xmin = 0, xmax = 10, ymin = 0, ymax = 10, fill = "gray92")+
  annotate("segment", linewidth = 2, x = 5, xend = 10, y = 5, yend = 10, arrow = arrow())+
  annotate("segment", linewidth = 2, x = 5, xend = 10, y = 5, yend = 5, arrow = arrow())+
  annotate("segment", linewidth = 2, x = 5, xend = 10, y = 5, yend = 0, arrow = arrow())+
  annotate("segment", linewidth = 2, x = 5, xend = 0, y = 5, yend = 0, arrow = arrow())+
  annotate("segment", linewidth = 2, x = 5, xend = 0, y = 5, yend = 5, arrow = arrow())+
  annotate("segment", linewidth = 2, x = 5, xend = 0, y = 5, yend = 10, arrow = arrow())+
  annotate("segment", linewidth = 2, x = 5, xend = 5, y = 5, yend = 10, arrow = arrow())+
  annotate("segment", linewidth = 2, x = 5, xend = 5, y = 5, yend = 0, arrow = arrow())+
   annotate("rect", xmin = 5.5, xmax = 4.5, ymin = 4.5, ymax = 5.5, color = "black", fill = "#339966" )+
  ylim(0,10)+
  xlim(0,10)+
  coord_fixed()+
  theme_void()+
  labs(title = "    Central point/area")

point_corner <- ggplot(data.frame(c(1:10),c(1:10)))+
  annotate("rect", xmin = 0, xmax = 10, ymin = 0, ymax = 10, fill = "gray92")+
  annotate("segment", linewidth = 2, x = 0, xend = 10, y = 10, yend = 0, arrow = arrow())+
  annotate("segment", linewidth = 2, x = 0, xend = 6.6, y = 10, yend = 0, arrow = arrow())+
  annotate("segment", linewidth = 2, x = 0, xend = 3.3, y = 10, yend = 0, arrow = arrow())+
  annotate("segment", linewidth = 2, x = 0, xend = 0, y = 10, yend = 0, arrow = arrow())+
  annotate("segment", linewidth = 2, x = 0, xend = 10, y = 10, yend = 3.3, arrow = arrow())+
  annotate("segment", linewidth = 2, x = 0, xend = 10, y = 10, yend = 6.6, arrow = arrow())+
  annotate("segment", linewidth = 2, x = 0, xend = 10, y = 10, yend = 10, arrow = arrow())+
  annotate("rect", xmin = 0, xmax = 1, ymin = 9, ymax = 10, color = "black", fill = "#339966")+
  ylim(0,10)+
  xlim(0,10)+
  coord_fixed()+
  theme_void()+
  labs(title = "    Corner point/area")

library(patchwork)
p_gradients <- (line | area)/
(point_central | point_corner)

ggsave("imgs/gradients.png", width =9, height =9, bg = "white")